Key Takeaways
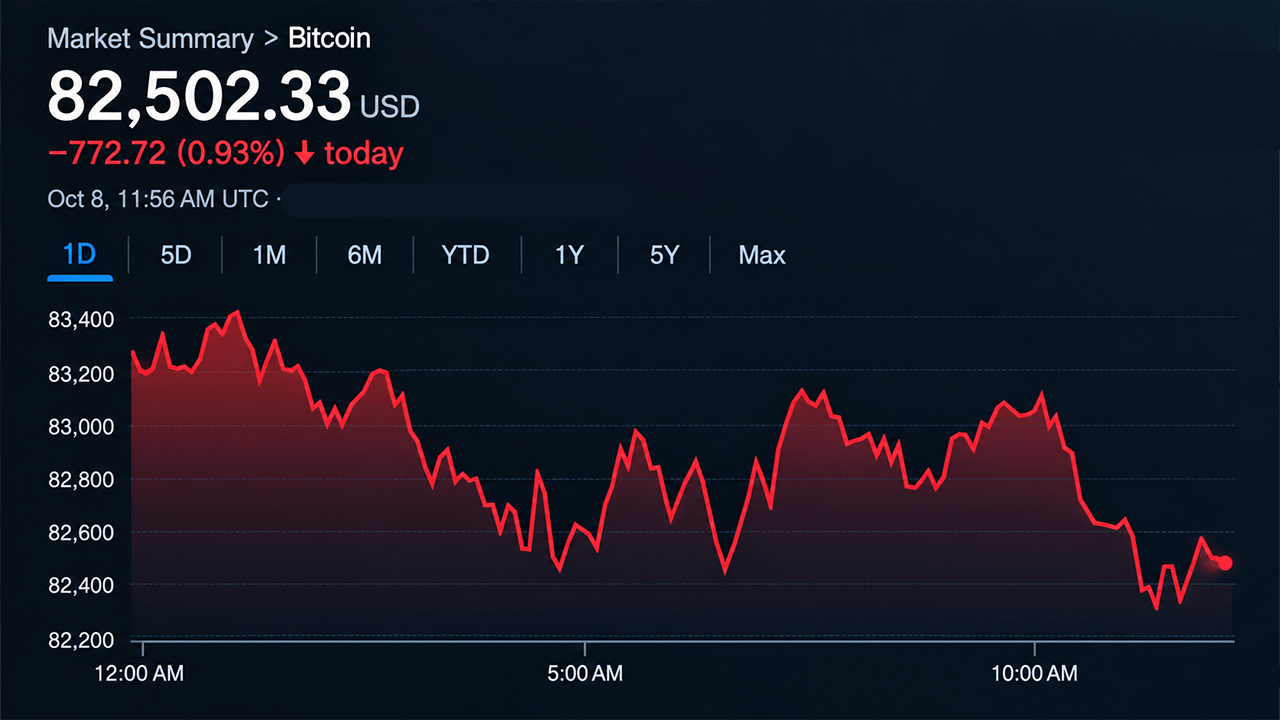
- Bitcoin’s price fell to $82,179.86 on Oct. 8 as sellers extended Wednesday’s decline.
- The daily views technicals remain neutral despite bearish short-term charts.
- Bitstamp’s BTC/USD chart puts $81,000 and $80,000 in focus if $82,180 breaks.
Bitcoin Technical Analysis: Bears Press $82,000 as Recovery Stalls
Bitcoin’s price is having a rough go of it this Thursday, Oct. 8, 2026, with the cryptocurrency hovering near $82,500 after surrendering more than $3,000 during the previous day’s selloff.
The curious part is that despite the damage, the daily technical summary remains neutral, with nine bullish readings, seven bearish readings, and ten neutral signals, suggesting the broader trend hasn’t entirely capitulated even as shorter time frames tell a considerably less encouraging story.
Hourly Chart Reveals a Fragile Recovery
The one-hour Bitstamp chart shows bitcoin struggling to recover after sliding to $82,179.86 during the 4 a.m. UTC candle. Buyers briefly pushed prices toward $83,211.83, but the rebound quickly ran out of steam, leaving bitcoin near $82,500 by 11:30 a.m. UTC.
The failure to sustain gains above $83,000 suggests sellers remain willing to unload positions into modest recoveries. Immediate support rests between $82,180 and $82,000, while resistance between $83,000 and $83,500 continues to frustrate bullish attempts. A convincing recovery above $83,500 would begin to challenge the immediate bearish structure.
Four-Hour Chart Keeps Sellers in the Driver’s Seat
The four-hour chart paints an equally difficult picture for buyers, with successive lower closes documenting the decline from $85,544.34 on Oct. 7. Bitcoin initially fell toward $84,121 before slipping through $83,700, $83,400 and eventually $82,700.
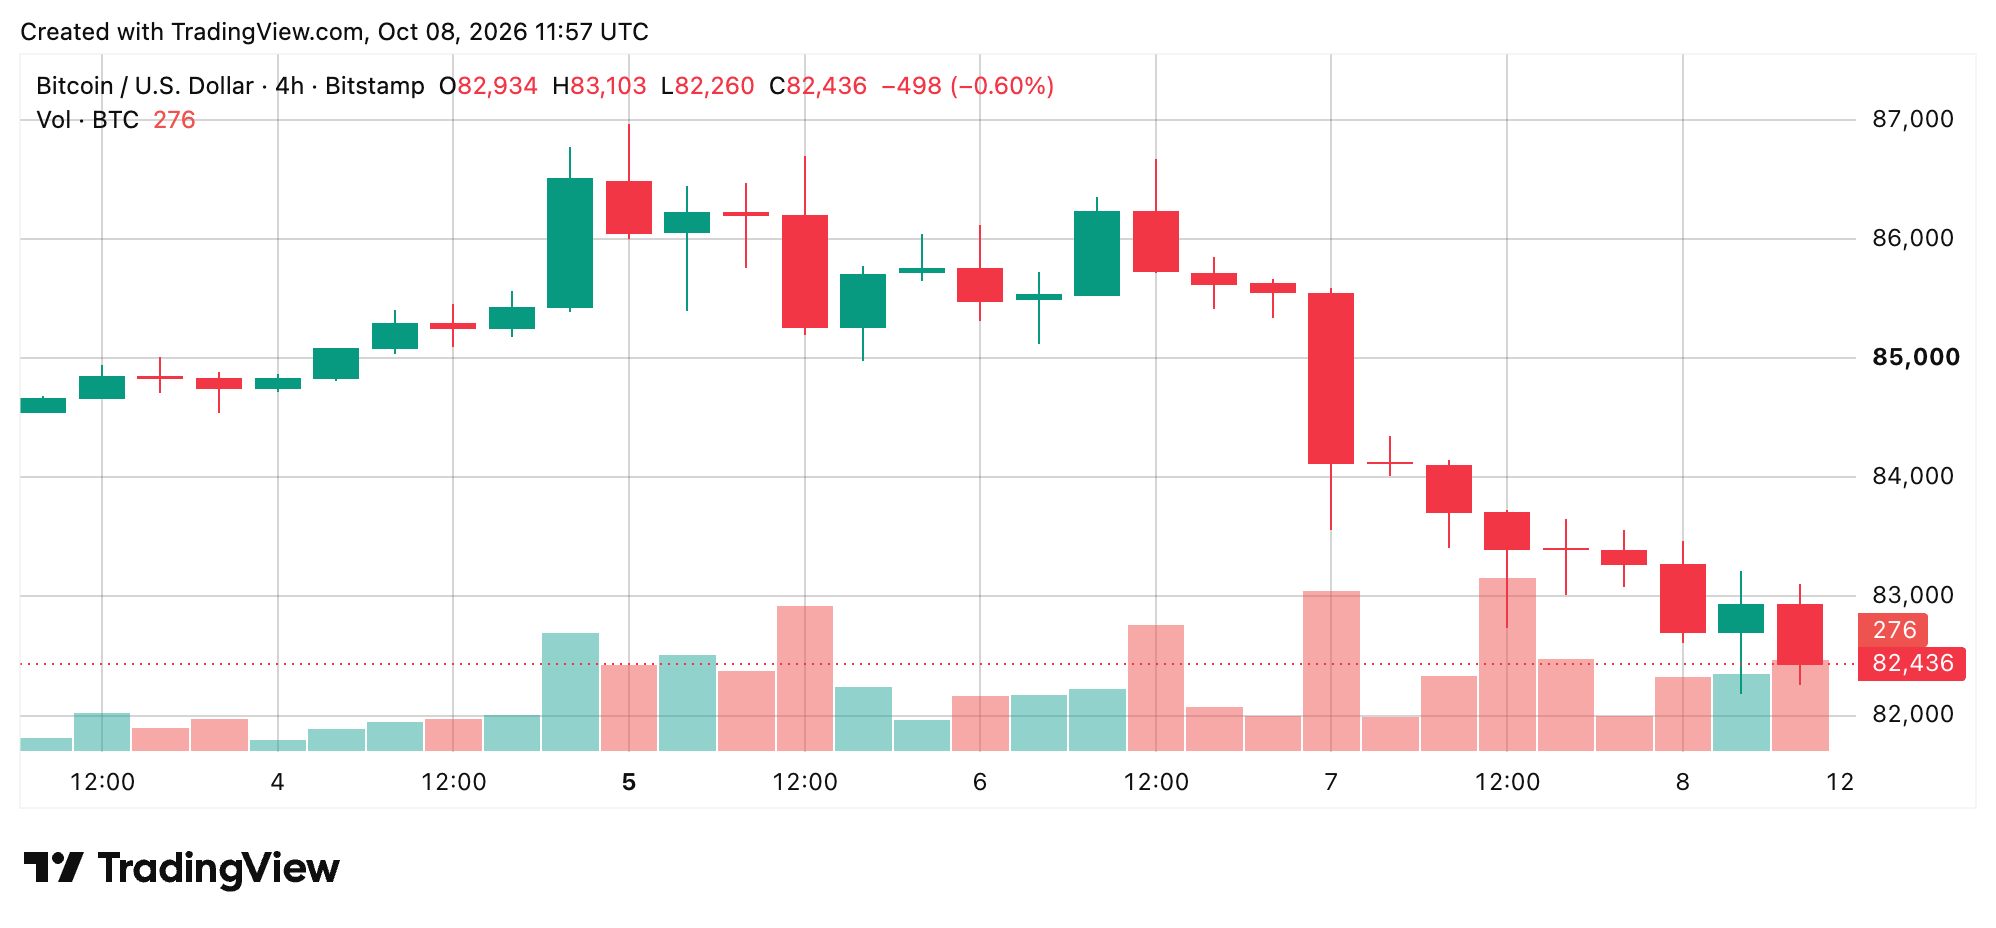
Although the 4 a.m. UTC candle on Oct. 8 recovered from $82,179.86 to close at $82,933.62, subsequent trading failed to maintain that progress. A confirmed four-hour close below $82,180 would strengthen the case for additional losses toward $81,500 and $81,000. Conversely, reclaiming $84,000 would provide an early indication that selling pressure is easing.
Daily Chart Exposes a Divided Technical Picture
The daily chart reveals how quickly bitcoin’s recent advance has deteriorated. After reaching $87,219.40 on Oct. 2, the cryptocurrency recorded progressively weaker highs before Wednesday’s decline carried prices from an opening of $85,544 to a closing of $83,274.
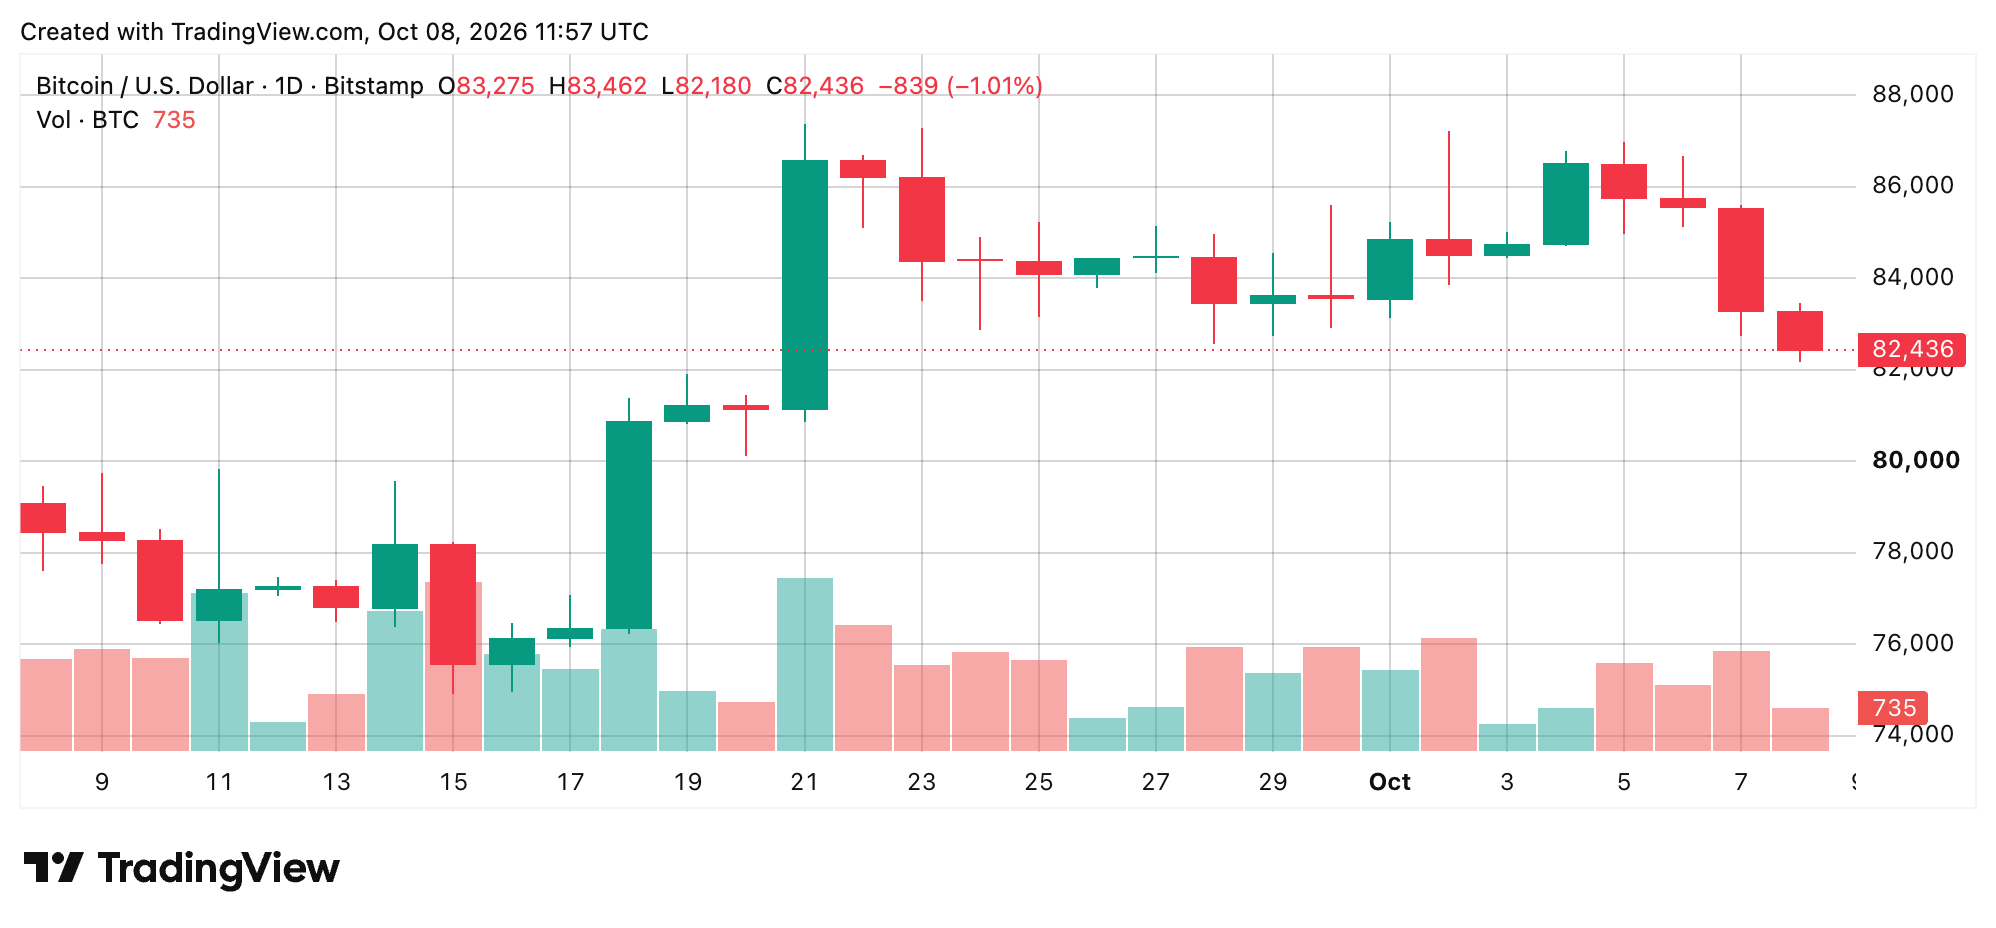
Thursday’s extension toward $82,180 has placed the $82,000 region squarely in focus, although the broader technical structure hasn’t completely broken down. Bitcoin remains above several longer-term averages, and the classic daily pivot near $81,950 provides another reference point. Losing that area would shift attention toward $80,000, while recovering $84,000 to $84,500 would help repair the immediate damage.
Oscillators Offer Little Comfort to Either Camp
Daily oscillators are hardly issuing a unanimous verdict, with nine neutral readings, one bullish reading and one bearish reading. The relative strength index (RSI) stands at 50, indicating neither an overbought nor oversold condition, while the Stochastic RSI sits at 12. The Williams percentage range registers minus 94, reflecting price action near the lower end of its recent range.
Meanwhile, moving average convergence divergence (MACD) remains bearish at 1,411, despite momentum registering a bullish reading at minus 981. The average directional index (ADX) at 41 suggests an established trend, although it doesn’t independently identify its direction.
Moving Averages Preserve a Narrow Bullish Foothold
The moving averages (MAs) tape tells perhaps the most interesting story. Bitcoin trades beneath its 10-period exponential moving average (EMA) at $84,178 and 20-period exponential moving average (EMA) at $83,390, yet remains above its 30-period exponential moving average (EMA) at $82,175 and 50-period exponential moving average (EMA) at $79,662. The 200-period simple moving average (SMA) sits considerably lower at $71,802, preserving a longer-term cushion despite the immediate retreat.
Bull verdict:
Defending $82,180 and reclaiming $83,500 would improve the prospects for a recovery toward $84,000 to $85,000.
Bear verdict:
Breaking $82,180 would expose $81,500, $81,000 and potentially $80,000. For now, the market’s next meaningful decision rests just above $82,000.