Key Takeaways
- Bitcoin’s price held $77,000 support as its Aug. 31 rebound pushed BTC back above $78,000 range. BTC’s price slid a hair following Strategy’s bitcoin purchase news.
- ARP Digital’s Yusuf Fakhro says bitcoin’s 23% run signals a broader market shift.
- Bitcoin’s moving averages flash strong bullish signals, but $79,300-$79,400 remains the next resistance test.
Bitcoin’s 1-Hour Chart Shows Buyers Digging In at $77K
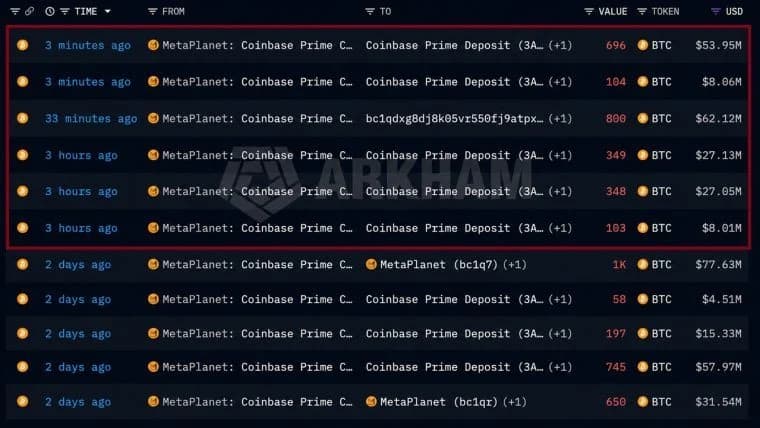
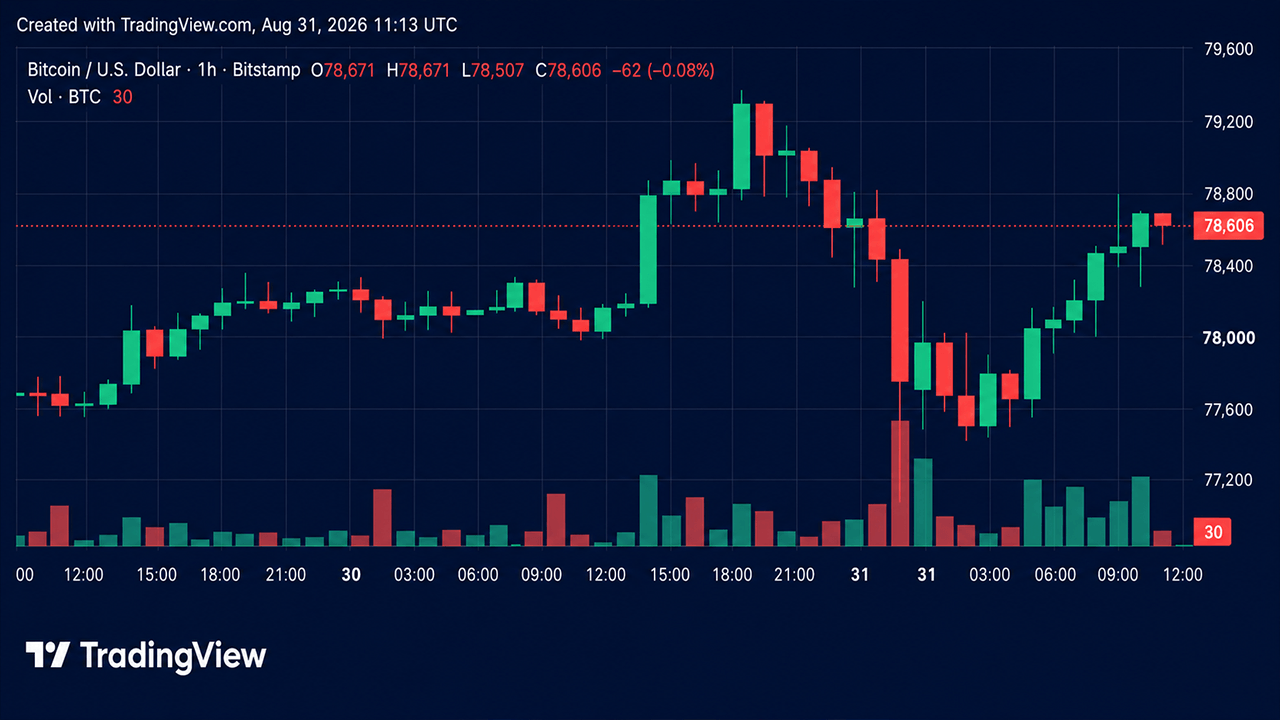
Bitcoin’s price metrics via the 1-hour chart show exactly where the damage stopped, with bitcoin dropping from a session high near $79,386 to a low of $77,024 before grinding back into the mid-$78,500s. Volume expanded on the way down, giving the sell-off some real weight, but buyers refused to let BTC revisit the session low during the rebound. The price dipped a hair following Strategy’s latest bitcoin purchase announcement as it slipped around 0.2% on the news.
Recent market movements remain mixed as the recovery works higher, putting $77,000-$77,200 firmly on the board as immediate support and $79,300-$79,400 as the ceiling buyers still have to crack. With bitcoin’s price currently hovering near $78,500, bitcoin sits almost squarely between those lines, leaving bulls and bears without a clean victory as Monday’s market session unfolds.
4-Hour Chart Shows Bitcoin’s Price Turns $77K Into the Line Bulls Can’t Lose
The 4-hour bitcoin price chart strips away some of the hourly noise, with the slide from roughly $79,400 to $77,000 and subsequent bounce defining the structure that matters now. The important part is what has not happened: bitcoin has not surrendered the $77,000 area, keeping the latest downswing from becoming a confirmed breakdown beneath observed support.
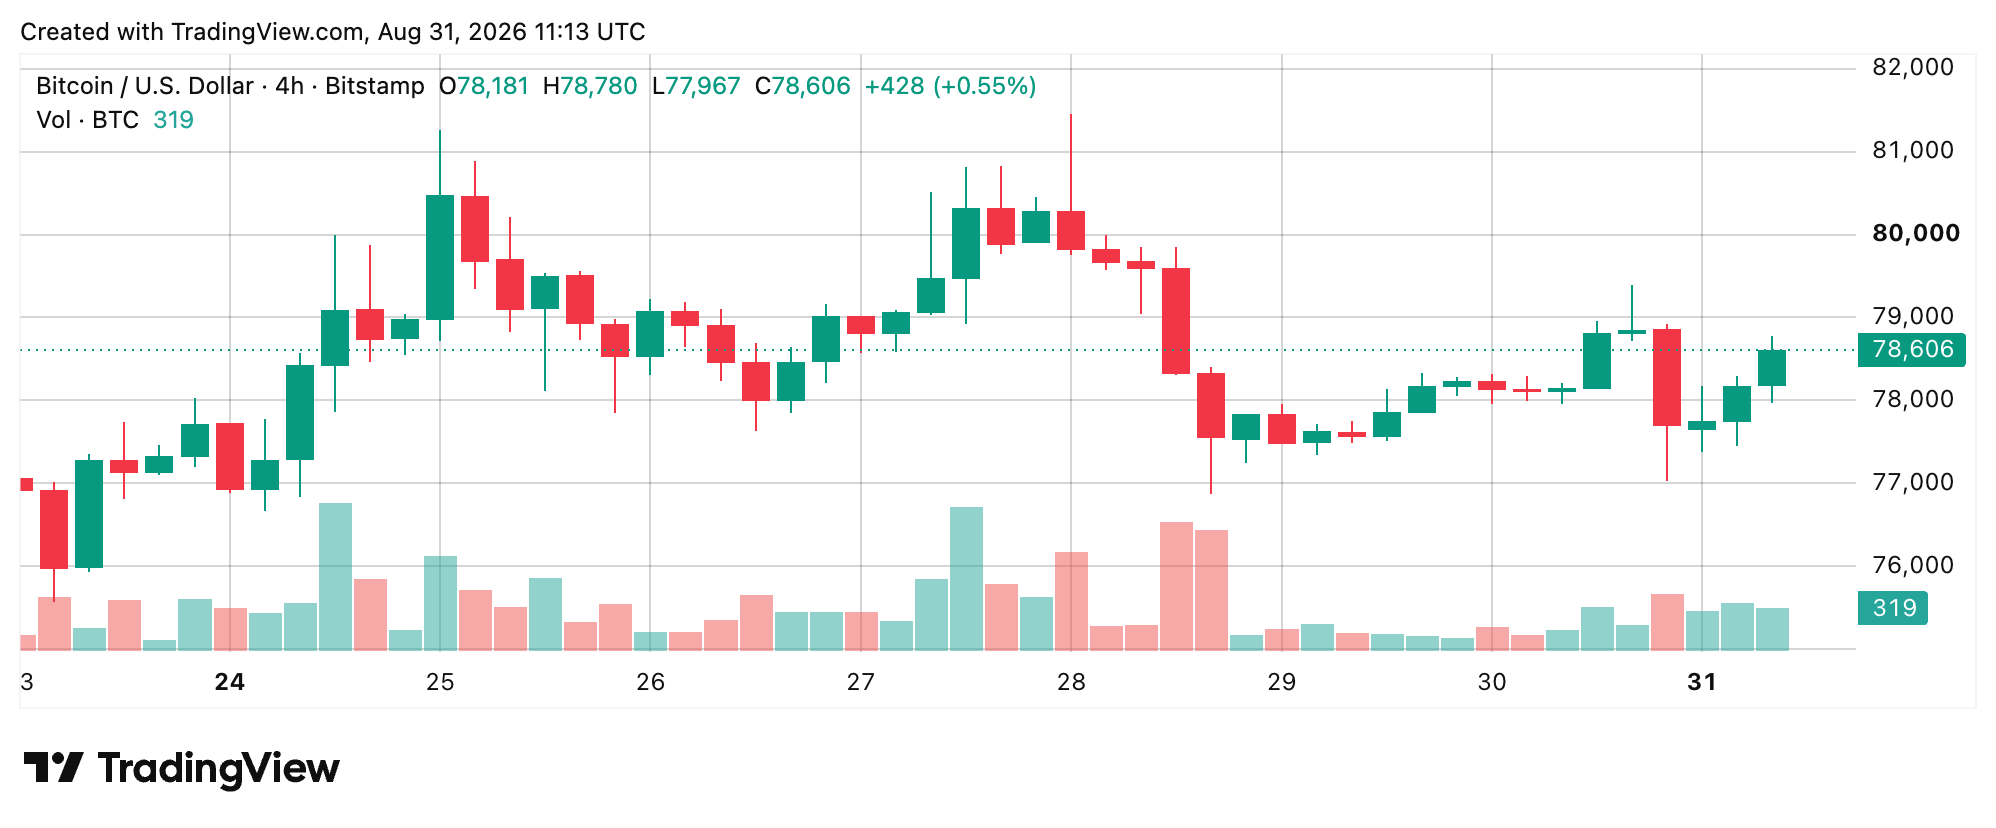
That traps BTC between buyers defending the bottom of the range and resistance less than $1,000 above the current $78,506 spot price. Until $77,000-$77,200 cracks or $79,300-$79,400 folds, the 4-hour setup remains a consolidation following a violent drop and incomplete recovery.
Daily Bitcoin Price Chart Underlines $80K Turning Into the Next Big Test
The daily bitcoin price chart exposes the bigger reset after bitcoin traded above $80,000 late last week, including an Aug. 27 close near $80,268. By Aug. 30, the historical close had fallen to approximately $77,658, dragging BTC back into the $77,000-$79,000 band before Monday’s rebound toward $78,000 to $78,500 zone.
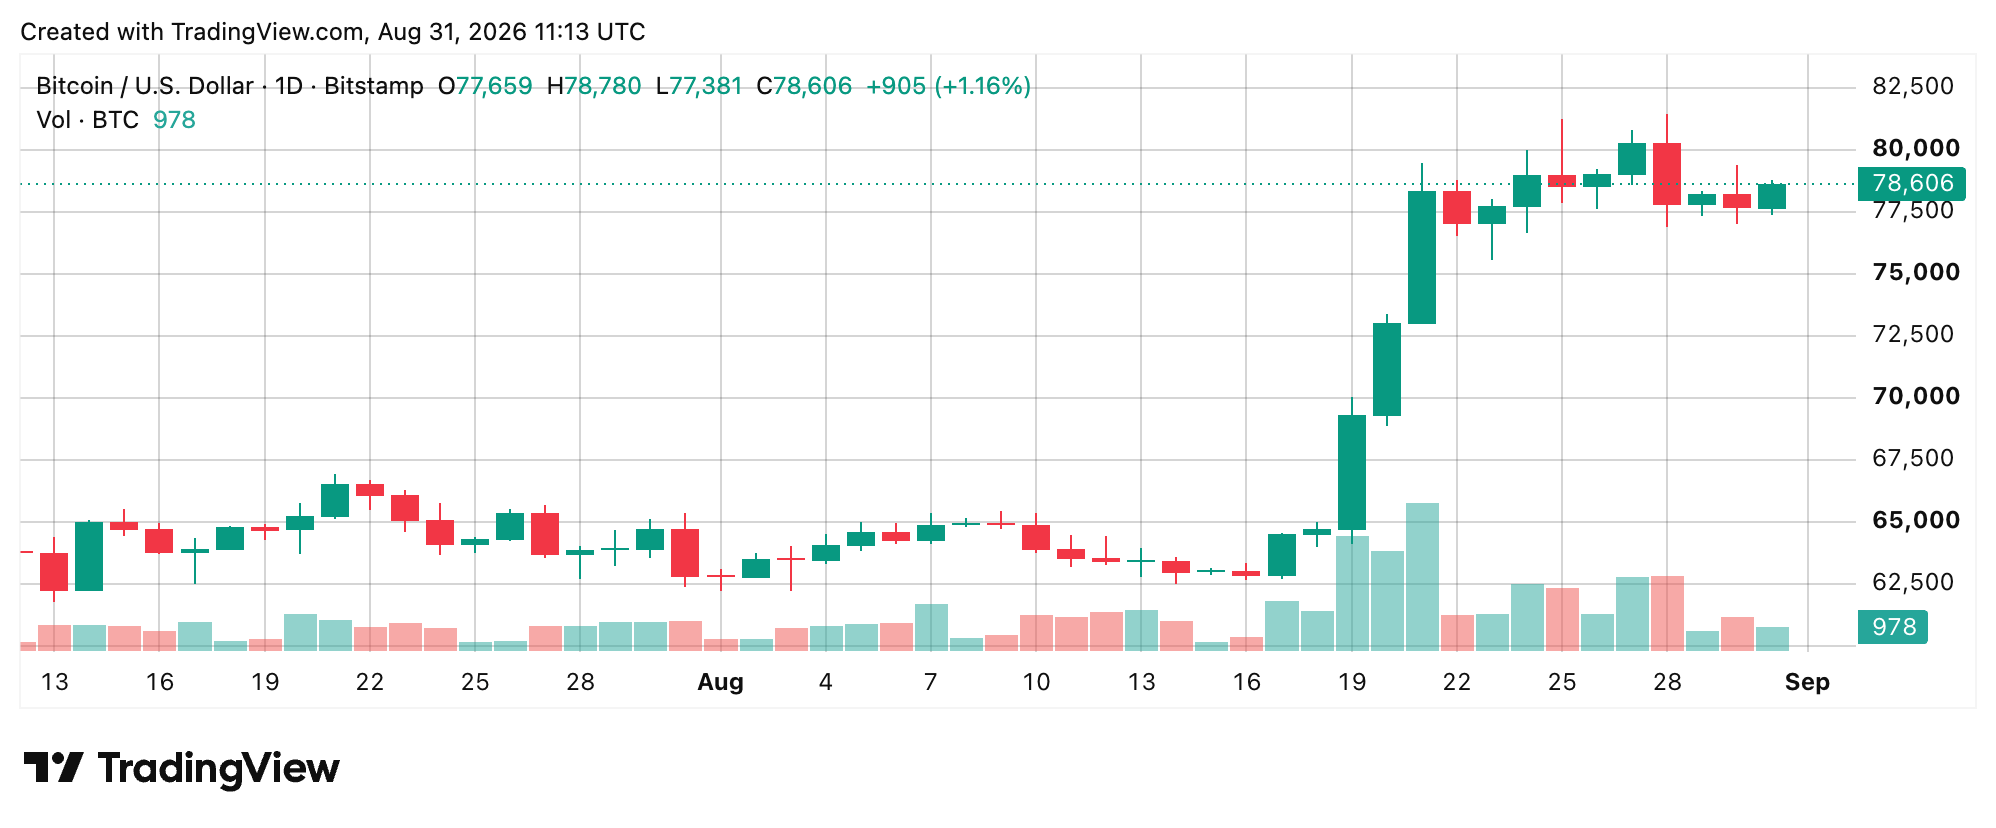
Even after that retreat, bitcoin remains comfortably above many of the longer-term moving averages tracked by the default technical indicators. Monday’s 24-hour range of $77,161.61-$79,346.68 also maps almost directly onto observed support and resistance, putting $77,000-$77,200 underneath the market and $79,300-$79,400 overhead as the lines traders now have to watch.
ARP Digital’s Fakhro Says Bitcoin’s Price Hold at $78K Matters More
In a market note shared with Bitcoin.com News on Monday, Yusuf Fakhro, partner at ARP Digital, a regulated digital capital infrastructure platform headquartered in Bahrain, sees bitcoin holding around $78,000 after its recent advance as more important than the breakout itself.
“Bitcoin holding around $78,000 after a 23% surge is more telling than the surge itself,” Fakhro told Bitcoin.com News, arguing that consolidation supports his view that the move represents “a genuine regime shift and not a flash in the pan.” He pointed to billions in short liquidations and falling perpetual open interest as evidence that forced buying cleared leverage instead of simply replacing it with another heavily leveraged run.
Fakhro also flagged bitcoin’s rapid reclaim of its 50-, 100- and 200-day moving averages and 200-week moving average, alongside stronger exchange-traded fund demand and shifting options positioning, as further confirmation. “When derivatives, flows, and price structure align this cleanly, I stop giving the bearish case the benefit of the doubt,” he said.
Fakhro nevertheless acknowledged the market could pull back after such a steep advance, saying “a sharp pullback from here would be normal price action, not a thesis-breaker.” His longer-term outlook remains bullish, arguing leverage has reset, institutional flows have returned and the structure resembles “the beginning of a cycle rather than the end of one.”
Bitcoin Oscillators Split as Momentum Throws Up a Warning
Bitcoin’s oscillator board via the daily chart refuses to confirm the bullish message coming from the moving averages, producing an overall neutral reading. The 14-period relative strength index (RSI) stands at 70 with a neutral signal, while the Stochastic stands at 81, the 20-period commodity channel index (CCI) is at 58, and the 14-period average directional index (ADX) at 43 remain neutral at the time of writing.
The Awesome oscillator (AO) reads 9,749 and is also neutral on Monday morning. The trouble spot is the 10-period momentum (MOM), registering minus 215 and a bearish signal, while the moving average convergence divergence (MACD) level, using 12- and 26-period settings, stands at 3,758 and flashes a bullish sign. The split leaves neither bulls nor bears with unanimous oscillator confirmation.
Bitcoin’s Moving Averages Stay Loaded Despite the Short-Term Fight
Presently, moving averages (MAs) remain the hardest bullish evidence on Monday’s technical board, with the category registering a strong buy despite one short-term holdout. The 10-period Exponential Moving Average (EMA) at $77,001 signals buy, while the 10-period Simple Moving Average (SMA) at $78,350 signals sell.
Every other listed average flashes buy: the 20-period EMA at $73,985 and SMA at $72,448; 30-period EMA at $71,869 and SMA at $69,697; 50-period EMA at $69,655 and SMA at $67,567; 100-period EMA at $68,849 and SMA at $66,221; and 200-period EMA at $72,224 and SMA at $69,426. With oscillators neutral, moving averages at strong buy and the combined technical summary at buy, bitcoin’s bigger trend remains constructive even as the short-term fight stays unresolved.
At press time, following Strategy’s latest buy announcement, BTC bulls are trying to hold the $78,000 zone, but they have been struggling. By 8:45 a.m. Eastern time, bitcoin’s price dipped below the $78,000 range on two occasions during the morning session’s battle between bears and bulls.
Bull Verdict:
Bitcoin’s price holding above $77,000 while moving averages flash strong bullish signals keeps the broader bullish structure alive. A decisive break through $79,300-$79,400 would put $80,000 back in play, and a break above $81,500 will signal that buyers have regained control.
Bear Verdict:
Neutral oscillators and a bearish signal from the momentum tape show the rebound still lacks unanimous confirmation. Losing $77,000-$77,200 would break the market’s immediate support and raise the risk that the latest bounce was only a temporary reprieve.